Evidence / owner-supplied source comparisons

Search performance.
With the context intact.

Eight supplied Google Search Console comparisons. Inspect the period totals, metric definitions, and original screenshots, including changes that moved in different directions.

These screenshots are anonymized and unmapped to named clients. They do not establish five distinct clients, campaign dates, sales, revenue, or exclusive causation. All relative growth is approximate because K/M display values are rounded.

SEO-01 / Daily source

Anonymized 28-day comparison

Displayed clicks rose from 242 to 362 and impressions from 28K to 38.4K over the compared 28-day windows. Rounded CTR was unchanged; average position improved.

Web · Last 28 days vs previous 28 days

The supplied master contains a property URL fragment and account avatar. Only a reviewed redacted derivative may be used publicly.
Absolute dates and property identity are unresolved. These are search metrics, with no claim about leads or revenue.

SEO-01 / Last 28 days vs previous 28 days

Search clicks

+50% approx.Approximately +49.6% (1.50× the previous period).

Clicks from Google Search results, as displayed by Google Search Console. A click is not a unique visitor, session, lead, or sale.

Displayed period totals; rounded K/M values. Changes are calculated from those values.
MetricPreviousCurrentChange
Search clicks242362+50% ≈
Search impressions28K38.4K+37% ≈
Average CTR0.9%0.9%0.0 pp
Average position21.717.2-4.5
Inspect source

Google Search Console / SEO-01

The supplied comparison

Last 28 days vs previous 28 days

Open image
SEO-01 supplied Google Search Console screenshot showing Last 28 days compared with Previous 28 days. The exact four metric pairs are listed on this page.

Owner-supplied, rounded search totals; not an independently audited account. Search clicks are not leads or revenue.

Methodology & evidence limits

Owner-supplied Google Search Console screenshot · Screenshot_20260922_104351_Chrome (1).jpg
Search: Web · Chart: Daily

Property identity and account chrome are removed where present. Screenshot-to-client mapping, absolute dates, and publication permissions remain unresolved.

  • The supplied master contains a property URL fragment and account avatar. Only a reviewed redacted derivative may be used publicly.
  • The 28-day window is shorter than the seven six-month comparisons; do not compare them as the same time basis.
  • These are Google Search Console screenshots supplied by Leads To Sales, not independently audited source accounts.
  • Absolute start/end dates, time zone, property identity, and screenshot-to-client mapping are unresolved. The filename and last-update text do not establish report dates.
  • No additional country, device, query, or page filters are visible; hidden filters were not independently checked.
  • K/M totals are rounded display values. Derived growth percentages and multiples are approximate.
  • Headline totals cover the stated comparison period. Monthly describes chart granularity, not monthly visitor totals.
  • No underlying export exists here; the displayed trace does not support invented daily/monthly numeric points or tooltip dates.
  • The comparisons do not establish leads, sales, revenue, paid-spend savings, exclusive causation, or distinct-client counts.

SEO-02 / Monthly source

Anonymized six-month comparison A

Displayed clicks and impressions rose; CTR fell by 5.1 percentage points and average position improved. Increased exposure did not mean every metric improved.

Web (text) · Last 6 months vs previous 6 months

The source trace peaks around relative bucket three. It does not establish steady growth.
Absolute dates and property identity are unresolved. These are search metrics, with no claim about leads or revenue.

SEO-02 / Last 6 months vs previous 6 months

Search clicks

0 clicks1,490 clicks

+450% approx.Approximately +449.8% (5.50× the previous period).

Clicks from Google Search results, as displayed by Google Search Console. A click is not a unique visitor, session, lead, or sale.

Displayed period totals; rounded K/M values. Changes are calculated from those values.
MetricPreviousCurrentChange
Search clicks2711.49K+450% ≈
Search impressions2.56K27.1K+959% ≈
Average CTR10.6%5.5%-5.1 pp
Average position9.58.3-1.2
Inspect source

Google Search Console / SEO-02

The supplied comparison

Last 6 months vs previous 6 months

Open image
SEO-02 supplied Google Search Console screenshot showing Last 6 months compared with Previous 6 months. The exact four metric pairs are listed on this page.

Owner-supplied, rounded search totals; not an independently audited account. Search clicks are not leads or revenue.

Methodology & evidence limits

Owner-supplied Google Search Console screenshot · image (10).png
Search: Web (text) · Chart: Monthly

Property identity and account chrome are removed where present. Screenshot-to-client mapping, absolute dates, and publication permissions remain unresolved.

  • The source trace peaks around relative bucket three. It does not establish steady growth.
  • These are Google Search Console screenshots supplied by Leads To Sales, not independently audited source accounts.
  • Absolute start/end dates, time zone, property identity, and screenshot-to-client mapping are unresolved. The filename and last-update text do not establish report dates.
  • No additional country, device, query, or page filters are visible; hidden filters were not independently checked.
  • K/M totals are rounded display values. Derived growth percentages and multiples are approximate.
  • Headline totals cover the stated comparison period. Monthly describes chart granularity, not monthly visitor totals.
  • No underlying export exists here; the displayed trace does not support invented daily/monthly numeric points or tooltip dates.
  • The comparisons do not establish leads, sales, revenue, paid-spend savings, exclusive causation, or distinct-client counts.

SEO-03 / Monthly source

Anonymized six-month comparison B

Displayed clicks and impressions rose while CTR fell by 10.8 percentage points and average position worsened from 8 to 10.9. Lower position is better.

Web (text) · Last 6 months vs previous 6 months

This comparison cannot be headlined as improved rankings or all-metric improvement.
Absolute dates and property identity are unresolved. These are search metrics, with no claim about leads or revenue.

SEO-03 / Last 6 months vs previous 6 months

Search clicks

0 clicks20,100 clicks

+66% approx.Approximately +66.1% (1.66× the previous period).

Clicks from Google Search results, as displayed by Google Search Console. A click is not a unique visitor, session, lead, or sale.

Displayed period totals; rounded K/M values. Changes are calculated from those values.
MetricPreviousCurrentChange
Search clicks12.1K20.1K+66% ≈
Search impressions52.9K167K+216% ≈
Average CTR22.8%12%-10.8 pp
Average position810.9+2.9
Inspect source

Google Search Console / SEO-03

The supplied comparison

Last 6 months vs previous 6 months

Open image
SEO-03 supplied Google Search Console screenshot showing Last 6 months compared with Previous 6 months. The exact four metric pairs are listed on this page.

Owner-supplied, rounded search totals; not an independently audited account. Search clicks are not leads or revenue.

Methodology & evidence limits

Owner-supplied Google Search Console screenshot · image (9).png
Search: Web (text) · Chart: Monthly

Property identity and account chrome are removed where present. Screenshot-to-client mapping, absolute dates, and publication permissions remain unresolved.

  • This comparison cannot be headlined as improved rankings or all-metric improvement.
  • These are Google Search Console screenshots supplied by Leads To Sales, not independently audited source accounts.
  • Absolute start/end dates, time zone, property identity, and screenshot-to-client mapping are unresolved. The filename and last-update text do not establish report dates.
  • No additional country, device, query, or page filters are visible; hidden filters were not independently checked.
  • K/M totals are rounded display values. Derived growth percentages and multiples are approximate.
  • Headline totals cover the stated comparison period. Monthly describes chart granularity, not monthly visitor totals.
  • No underlying export exists here; the displayed trace does not support invented daily/monthly numeric points or tooltip dates.
  • The comparisons do not establish leads, sales, revenue, paid-spend savings, exclusive causation, or distinct-client counts.

SEO-04 / Monthly source

Anonymized six-month comparison C

Displayed clicks and impressions rose, CTR fell by 7.8 percentage points, and average position improved by 0.4.

Web (text) · Last 6 months vs previous 6 months

Dashed previous-period traces do not span every displayed relative bucket. The reason is unknown; missing segments are not observed zero months.
Absolute dates and property identity are unresolved. These are search metrics, with no claim about leads or revenue.

SEO-04 / Last 6 months vs previous 6 months

Search clicks

0 clicks5,210 clicks

+155% approx.Approximately +155.4% (2.55× the previous period).

Clicks from Google Search results, as displayed by Google Search Console. A click is not a unique visitor, session, lead, or sale.

Displayed period totals; rounded K/M values. Changes are calculated from those values.
MetricPreviousCurrentChange
Search clicks2.04K5.21K+155% ≈
Search impressions16K105K+556% ≈
Average CTR12.8%5%-7.8 pp
Average position7.26.8-0.4
Inspect source

Google Search Console / SEO-04

The supplied comparison

Last 6 months vs previous 6 months

Open image
SEO-04 supplied Google Search Console screenshot showing Last 6 months compared with Previous 6 months. The exact four metric pairs are listed on this page.

Owner-supplied, rounded search totals; not an independently audited account. Search clicks are not leads or revenue.

Methodology & evidence limits

Owner-supplied Google Search Console screenshot · image (8).png
Search: Web (text) · Chart: Monthly

Property identity and account chrome are removed where present. Screenshot-to-client mapping, absolute dates, and publication permissions remain unresolved.

  • Dashed previous-period traces do not span every displayed relative bucket. The reason is unknown; missing segments are not observed zero months.
  • These are Google Search Console screenshots supplied by Leads To Sales, not independently audited source accounts.
  • Absolute start/end dates, time zone, property identity, and screenshot-to-client mapping are unresolved. The filename and last-update text do not establish report dates.
  • No additional country, device, query, or page filters are visible; hidden filters were not independently checked.
  • K/M totals are rounded display values. Derived growth percentages and multiples are approximate.
  • Headline totals cover the stated comparison period. Monthly describes chart granularity, not monthly visitor totals.
  • No underlying export exists here; the displayed trace does not support invented daily/monthly numeric points or tooltip dates.
  • The comparisons do not establish leads, sales, revenue, paid-spend savings, exclusive causation, or distinct-client counts.

SEO-05 / Monthly source

Anonymized six-month comparison D

The source displays 30.5K clicks and 623K impressions against prior displayed zeros. Percentage growth and growth multiples are not defined from that baseline.

Web (text) · Last 6 months vs previous 6 months

A prior displayed zero does not establish a new website, zero historical traffic, or no prior business.
Absolute dates and property identity are unresolved. These are search metrics, with no claim about leads or revenue.

30.5Kcurrent-period search clicks623Kcurrent-period search impressions

Prior displayed counts are zero. Growth percentages and multiples are undefined.

SEO-05 / Last 6 months vs previous 6 months

Search clicks

30.5K currentPercentage growth and multiplier are not defined from this displayed zero baseline.

Clicks from Google Search results, as displayed by Google Search Console. A click is not a unique visitor, session, lead, or sale.

Displayed period totals; rounded K/M values. Changes are calculated from those values.
MetricPreviousCurrentChange
Search clicks030.5KUndefined
Search impressions0623KUndefined
Average CTR0%4.9%+4.9 pp
Average position08.1Undefined
Inspect source

Google Search Console / SEO-05

The supplied comparison

Last 6 months vs previous 6 months

Open image
SEO-05 supplied Google Search Console screenshot showing Last 6 months compared with Previous 6 months. The exact four metric pairs are listed on this page.

Owner-supplied, rounded search totals; not an independently audited account. Search clicks are not leads or revenue.

Methodology & evidence limits

Owner-supplied Google Search Console screenshot · image (7).png
Search: Web (text) · Chart: Monthly

Property identity and account chrome are removed where present. Screenshot-to-client mapping, absolute dates, and publication permissions remain unresolved.

  • A prior displayed zero does not establish a new website, zero historical traffic, or no prior business.
  • Previous average position zero is not a meaningful rank baseline.
  • Only four relative chart buckets are visible despite the six-month headline label; exact coverage needs an export.
  • These are Google Search Console screenshots supplied by Leads To Sales, not independently audited source accounts.
  • Absolute start/end dates, time zone, property identity, and screenshot-to-client mapping are unresolved. The filename and last-update text do not establish report dates.
  • No additional country, device, query, or page filters are visible; hidden filters were not independently checked.
  • K/M totals are rounded display values. Derived growth percentages and multiples are approximate.
  • Headline totals cover the stated comparison period. Monthly describes chart granularity, not monthly visitor totals.
  • No underlying export exists here; the displayed trace does not support invented daily/monthly numeric points or tooltip dates.
  • The comparisons do not establish leads, sales, revenue, paid-spend savings, exclusive causation, or distinct-client counts.

SEO-06 / Monthly source

Anonymized six-month comparison E

Displayed clicks were approximately 3.10 times the previous total and impressions approximately 5.92 times. CTR fell by 0.7 percentage points; average position improved.

Web (text) · Last 6 months vs previous 6 months

Higher count totals coexist with a lower CTR; preserve both in the explanation.
Absolute dates and property identity are unresolved. These are search metrics, with no claim about leads or revenue.

SEO-06 / Last 6 months vs previous 6 months

Search clicks

0 clicks14,700 clicks

+210% approx.Approximately +210.1% (3.10× the previous period).

Clicks from Google Search results, as displayed by Google Search Console. A click is not a unique visitor, session, lead, or sale.

Displayed period totals; rounded K/M values. Changes are calculated from those values.
MetricPreviousCurrentChange
Search clicks4.74K14.7K+210% ≈
Search impressions319K1.89M+492% ≈
Average CTR1.5%0.8%-0.7 pp
Average position10.28.5-1.7
Inspect source

Google Search Console / SEO-06

The supplied comparison

Last 6 months vs previous 6 months

Open image
SEO-06 supplied Google Search Console screenshot showing Last 6 months compared with Previous 6 months. The exact four metric pairs are listed on this page.

Owner-supplied, rounded search totals; not an independently audited account. Search clicks are not leads or revenue.

Methodology & evidence limits

Owner-supplied Google Search Console screenshot · image (6).png
Search: Web (text) · Chart: Monthly

Property identity and account chrome are removed where present. Screenshot-to-client mapping, absolute dates, and publication permissions remain unresolved.

  • Higher count totals coexist with a lower CTR; preserve both in the explanation.
  • These are Google Search Console screenshots supplied by Leads To Sales, not independently audited source accounts.
  • Absolute start/end dates, time zone, property identity, and screenshot-to-client mapping are unresolved. The filename and last-update text do not establish report dates.
  • No additional country, device, query, or page filters are visible; hidden filters were not independently checked.
  • K/M totals are rounded display values. Derived growth percentages and multiples are approximate.
  • Headline totals cover the stated comparison period. Monthly describes chart granularity, not monthly visitor totals.
  • No underlying export exists here; the displayed trace does not support invented daily/monthly numeric points or tooltip dates.
  • The comparisons do not establish leads, sales, revenue, paid-spend savings, exclusive causation, or distinct-client counts.

SEO-08 / Monthly source

Anonymized six-month comparison G

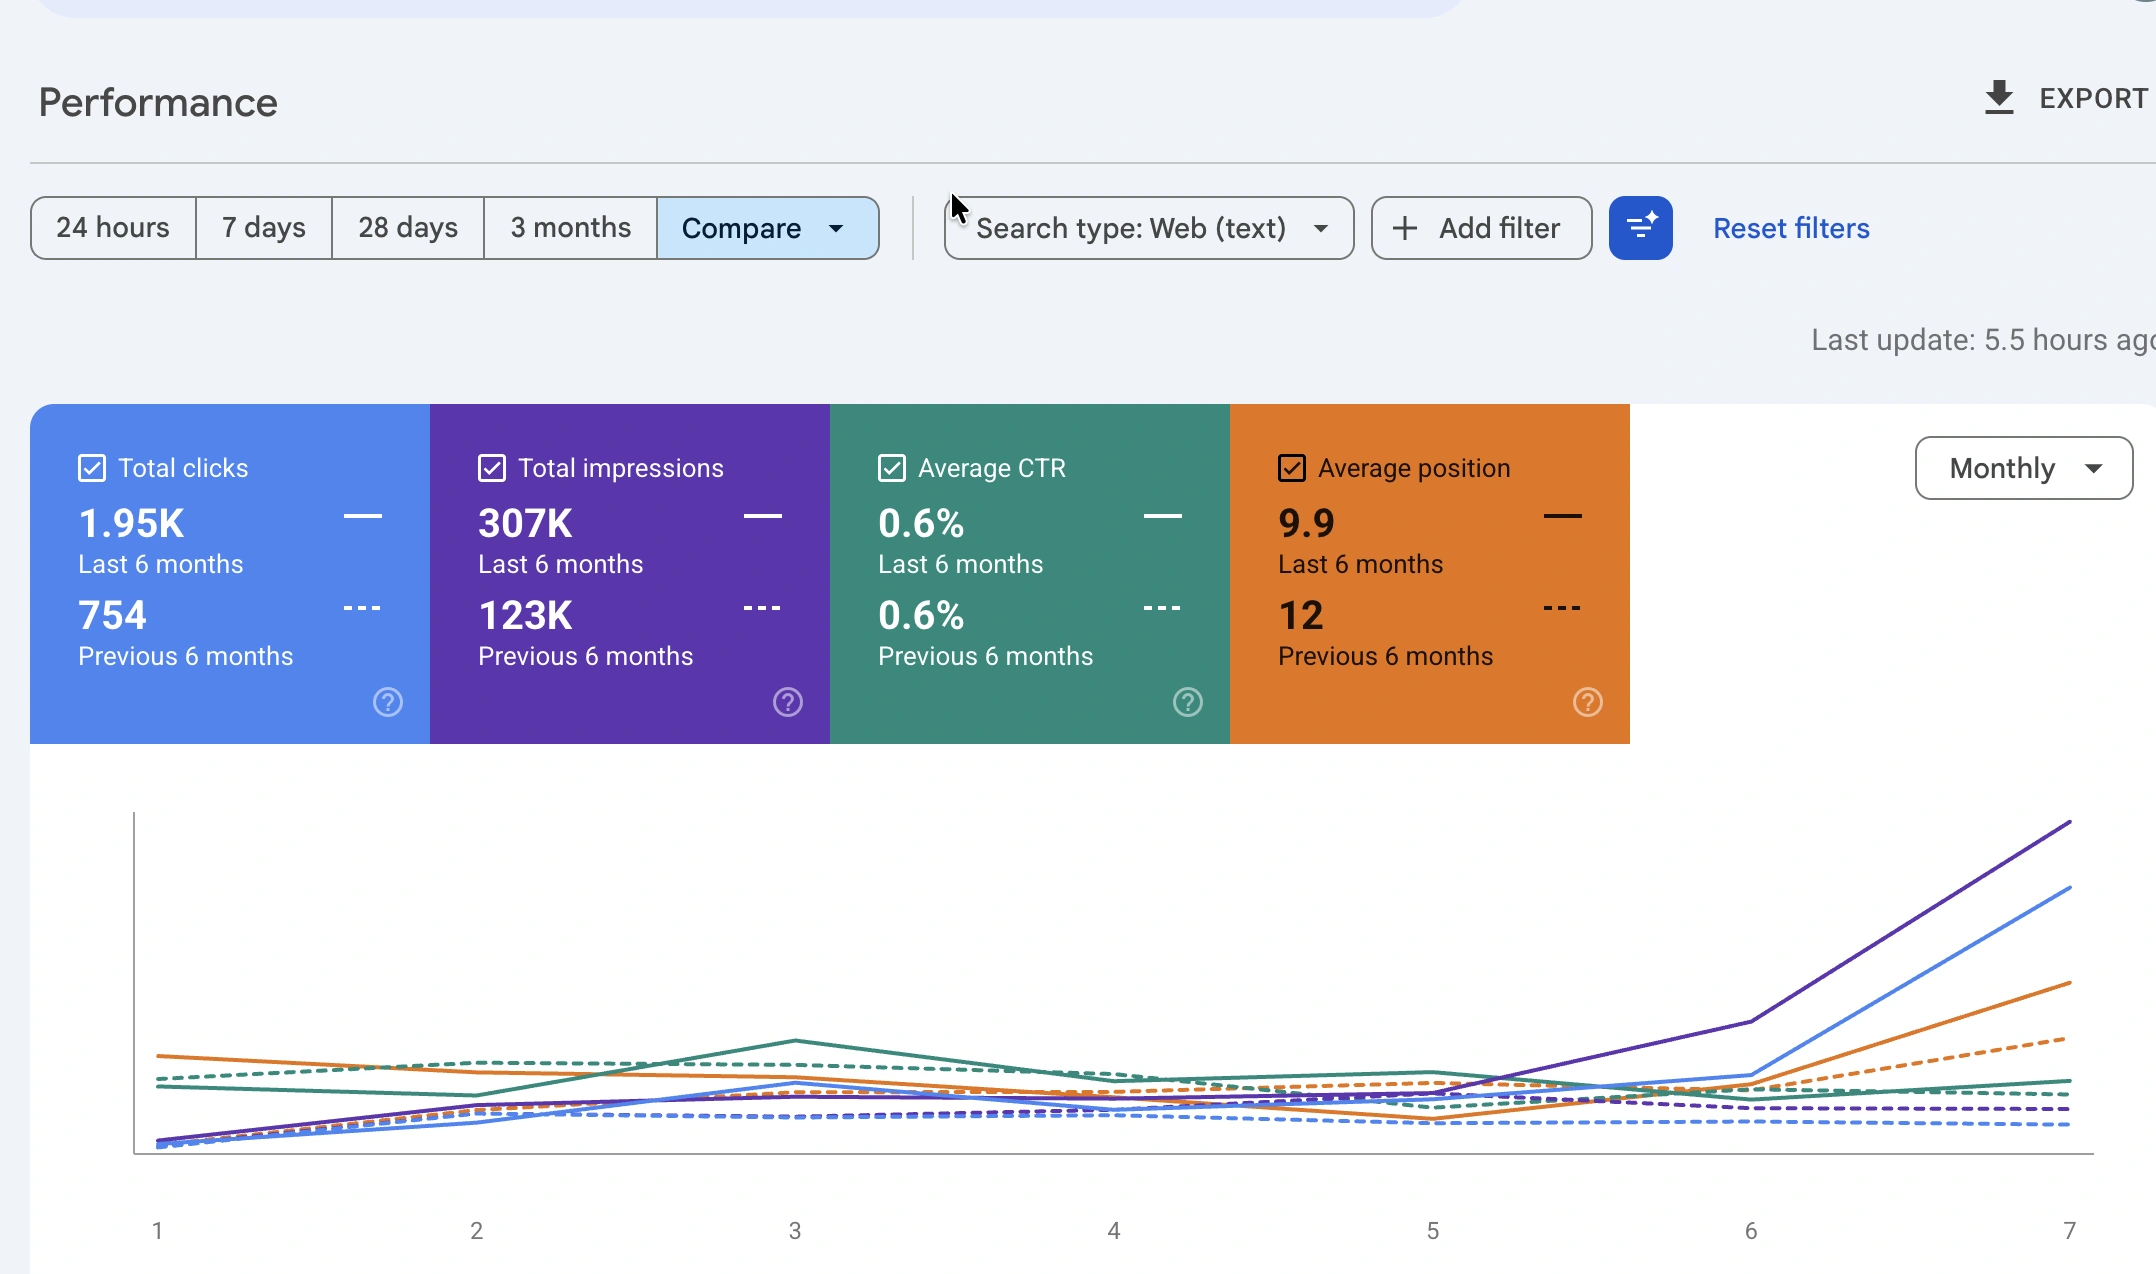
Displayed clicks and impressions rose, rounded CTR stayed at 0.6%, and average position improved from 12 to 9.9.

Web (text) · Last 6 months vs previous 6 months

The late relative chart bucket rises sharply. Its exact numeric value and calendar date are not available.
Absolute dates and property identity are unresolved. These are search metrics, with no claim about leads or revenue.

SEO-08 supplied source: the plotted trace shows a late relative-bucket rise; exact dates and point values are unavailable.
Original plotted trace. We do not reconstruct numeric points from its pixels.
SEO-08 / Last 6 months vs previous 6 months

Search clicks

+159% approx.Approximately +158.6% (2.59× the previous period).

Clicks from Google Search results, as displayed by Google Search Console. A click is not a unique visitor, session, lead, or sale.

Displayed period totals; rounded K/M values. Changes are calculated from those values.
MetricPreviousCurrentChange
Search clicks7541.95K+159% ≈
Search impressions123K307K+150% ≈
Average CTR0.6%0.6%0.0 pp
Average position129.9-2.1
Inspect source

Google Search Console / SEO-08

The supplied comparison

Last 6 months vs previous 6 months

Open image
SEO-08 supplied Google Search Console screenshot showing Last 6 months compared with Previous 6 months. The exact four metric pairs are listed on this page.

Owner-supplied, rounded search totals; not an independently audited account. Search clicks are not leads or revenue.

Methodology & evidence limits

Owner-supplied Google Search Console screenshot · image (4).png
Search: Web (text) · Chart: Monthly

Property identity and account chrome are removed where present. Screenshot-to-client mapping, absolute dates, and publication permissions remain unresolved.

  • The late relative chart bucket rises sharply. Its exact numeric value and calendar date are not available.
  • These are Google Search Console screenshots supplied by Leads To Sales, not independently audited source accounts.
  • Absolute start/end dates, time zone, property identity, and screenshot-to-client mapping are unresolved. The filename and last-update text do not establish report dates.
  • No additional country, device, query, or page filters are visible; hidden filters were not independently checked.
  • K/M totals are rounded display values. Derived growth percentages and multiples are approximate.
  • Headline totals cover the stated comparison period. Monthly describes chart granularity, not monthly visitor totals.
  • No underlying export exists here; the displayed trace does not support invented daily/monthly numeric points or tooltip dates.
  • The comparisons do not establish leads, sales, revenue, paid-spend savings, exclusive causation, or distinct-client counts.

Marathon / discovery time

Marathon reports that average client discovery changed from roughly 40–45 minutes to 5–8 minutes.

Reported by Marathon in Fourth Crossing’s public case. Website and internal-system evidence remain distinct.

Read the case context
Approximate client-reported ranges; no independently timed study.
BeforeRoughly 40–45 minutes
AfterRoughly 5–8 minutes
PeriodMeasurement dates and method are not published

Client-reported; not an independently audited timing study. Exact dates, sample, method, and cross-team contribution remain unresolved. Do not calculate guaranteed percentage savings, infer revenue, or attribute the outcome exclusively to LTS.

Inspect public source

More visibility can come
with a lower CTR.

A wider set of search appearances can change click-through rate even while click totals grow. Average position is also a global measure, rather than a promise about every keyword.

What would make this
evidence stronger?

  • The original export with absolute start and end dates.
  • Verified property identity and screenshot-to-client mapping.
  • Confirmed filter and comparison coverage.
  • A separate, reconciled lead and sales measurement model.

Let’s build what’s next

What should work
better in your business?

Bring us the bottleneck. We’ll talk through the work, the people, and what a useful next step could look like.